 Web Server Statistics for hubertchan.ca Web Server Statistics for hubertchan.ca
(Go To: Top: General Summary: Daily Summary: Hourly Summary: Domain Report: Organization Report: Operating System Report: Status Code Report: File Size Report: File Type Report: Directory Report: Request Report)
This report contains overall statistics.
Successful requests: 2,684
Average successful requests per day: 2,686
Successful requests for pages: 2,637
Average successful requests for pages per day: 2,639
Failed requests: 844
Distinct files requested: 81
Distinct hosts served: 50
Corrupt logfile lines: 5
Data transferred: 51.48 megabytes
Average data transferred per day: 51.55 megabytes
(Go To: Top: General Summary: Daily Summary: Hourly Summary: Domain Report: Organization Report: Operating System Report: Status Code Report: File Size Report: File Type Report: Directory Report: Request Report)
This report lists the total activity for each day of the week, summed over all the weeks in the report.
Each unit ( ) represents 60 requests
for pages or part thereof.
) represents 60 requests
for pages or part thereof.
day: #reqs: #pages: ---: -----: ------: Sun: 0: 0: Mon: 0: 0: Tue: 2684: 2637:Wed: 0: 0: Thu: 0: 0: Fri: 0: 0: Sat: 0: 0:
(Go To: Top: General Summary: Daily Summary: Hourly Summary: Domain Report: Organization Report: Operating System Report: Status Code Report: File Size Report: File Type Report: Directory Report: Request Report)
This report lists the total activity for each hour of the day, summed over all the days in the report.
Each unit () represents 4 requests
for pages or part thereof.
hour: #reqs: #pages: ----: -----: ------: 0: 124: 123:2: 112: 110:
4: 107: 104:
5: 127: 124:
(Go To: Top: General Summary: Daily Summary: Hourly Summary: Domain Report: Organization Report: Operating System Report: Status Code Report: File Size Report: File Type Report: Directory Report: Request Report)
This report lists the countries of the computers which requested files.

Listing domains, sorted by the amount of traffic.
#reqs: %bytes: domain
-----: ------: ------
 2635: 74.72%: [unresolved numerical addresses]
   23: 17.46%: .com (Commercial)
   25:  7.80%: [unknown domain]
    1:  0.02%: .cz (Czech Republic)
(Go To: Top: General Summary: Daily Summary: Hourly Summary: Domain Report: Organization Report: Operating System Report: Status Code Report: File Size Report: File Type Report: Directory Report: Request Report)
This report lists the organizations of the computers which requested files.

Listing organizations, sorted by the number of requests.
#reqs: %bytes: organization
-----: ------: ------------
 2584: 48.70%: 77
   41: 14.99%: 216.244
   25:  7.80%: [unknown domain]
   19: 13.10%: semrush.com
    3:  3.32%: colocrossing.com
    3:  3.32%: 23
    2:  2.28%: 104
    2:  2.22%: 160.250
    2:  2.22%: 156.230
    1:  0.02%: nwt.cz
    1:  0.99%: 72
    1:  1.04%: hosted-by-vdsina.com
(Go To: Top: General Summary: Daily Summary: Hourly Summary: Domain Report: Organization Report: Operating System Report: Status Code Report: File Size Report: File Type Report: Directory Report: Request Report)
This report lists the operating systems used by visitors.
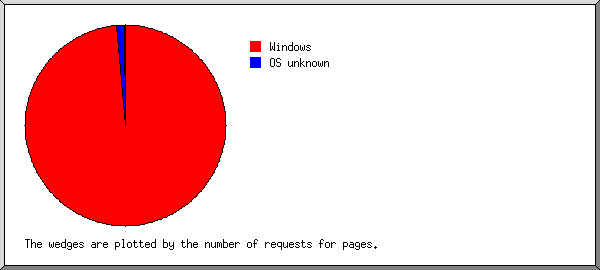
Listing operating systems, sorted by the number of requests for pages.
 #: #reqs: #pages: OS
--: -----: ------: --
 1:  2593:   2593: Windows
  :  2593:   2593:   Windows NT
 2:    88:     41: OS unknown
 3:     2:      2: Macintosh
 4:     1:      1: Unix
  :     1:      1:   Linux
(Go To: Top: General Summary: Daily Summary: Hourly Summary: Domain Report: Organization Report: Operating System Report: Status Code Report: File Size Report: File Type Report: Directory Report: Request Report)
This report lists the HTTP status codes of all requests.

Listing status codes, sorted numerically.
#reqs: status code
-----: -----------
 2684: 200 OK
   21: 403 Access forbidden
  823: 404 Document not found
(Go To: Top: General Summary: Daily Summary: Hourly Summary: Domain Report: Organization Report: Operating System Report: Status Code Report: File Size Report: File Type Report: Directory Report: Request Report)
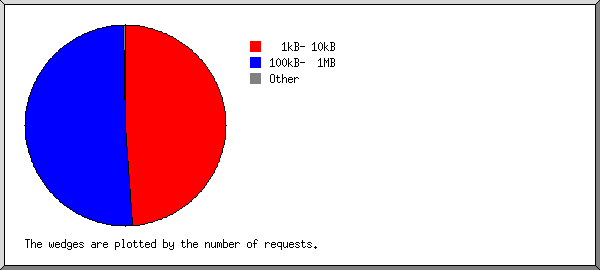
This report lists the sizes of files.
       size: #reqs: %bytes:
-----------: -----: ------:
          0:     0:       :
   1B-  10B:     0:       :
  11B- 100B:     0:       :
 101B-  1kB:     0:       :
  1kB- 10kB:  2632: 49.00%:
 10kB-100kB:     1:  0.09%:
100kB-  1MB:    50: 43.42%:
  1MB- 10MB:     1:  7.49%:
(Go To: Top: General Summary: Daily Summary: Hourly Summary: Domain Report: Organization Report: Operating System Report: Status Code Report: File Size Report: File Type Report: Directory Report: Request Report)
This report lists the extensions of files.

Listing extensions with at least 0.1% of the traffic, sorted by the amount of traffic.
#reqs: %bytes: extension
-----: ------: ---------
 2586: 48.73%: [directories]
   51: 43.51%: .html [Hypertext Markup Language]
    1:  7.49%: .zip  [Zip archives]
   46:  0.27%: .png  [PNG graphics]
(Go To: Top: General Summary: Daily Summary: Hourly Summary: Domain Report: Organization Report: Operating System Report: Status Code Report: File Size Report: File Type Report: Directory Report: Request Report)
This report lists the directories from which files were requested. (The figures for each directory include all of its subdirectories.)
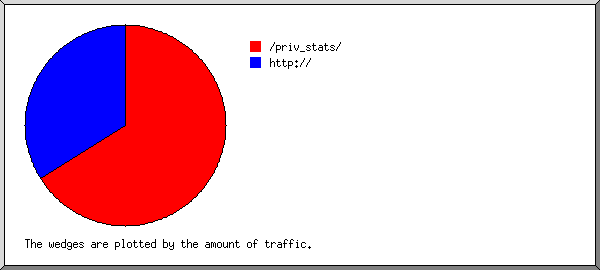
Listing directories with at least 0.01% of the traffic, sorted by the amount of traffic.
#reqs: %bytes: directory
-----: ------: ---------
 2682: 91.41%: /priv_stats/
    1:  7.49%: /fileshare/
    1:  1.11%: http://
(Go To: Top: General Summary: Daily Summary: Hourly Summary: Domain Report: Organization Report: Operating System Report: Status Code Report: File Size Report: File Type Report: Directory Report: Request Report)
This report lists the files on the site.
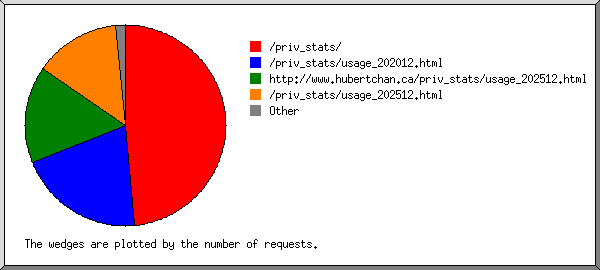
Listing files with at least 20 requests, sorted by the number of requests.
#reqs: %bytes:          last time: file
-----: ------: ------------------: ----
 2586: 48.73%: Jul/28/26 11:56 PM: /priv_stats/
   98: 51.27%: Jul/28/26 11:58 PM: [not listed: 80 files]
(Go To: Top: General Summary: Daily Summary: Hourly Summary: Domain Report: Organization Report: Operating System Report: Status Code Report: File Size Report: File Type Report: Directory Report: Request Report)

